Problem: Voter turnout in midterm elections have decreased, especially among young citizens & minority groups.
Contribution: Conducted user research on American citizens consisting of various age groups & diverse backgrounds, Created a brand identity that aligns with the mission to reach young voters. Created wireframes and brainstormed user flows & actions to achieve important tasks. Implemented design changes based on user feedback.
Contraints: Traditional red, white & blue colors were prohibited; creating infographic charts from scratch took a lot of time.
Outcome: Created an unbiased infographic site to raise awareness, inform voters about midterm elections, & highlight its impact on society.
Project Goals
Increase youth & minority voter registration through accessible tools.
Improve mid-term turnout rates among underrepresented groups.
Inform U.S. citizens about key political issues in mid-term elections.
Empower citizens to vote & impact their communities effectively.
Challenges
Problem: Racial turnout gap widened from 9 points in 2008 to 16 points in 2022.
Impact: 17% of unregistered Black youth face registration barriers; 13% lack proper voting ID vs. 5% of white citizens.
User Feedback: Need for clear, engaging resources to boost awareness & participation.
Solutions
Key Features: Interactive voter registration form, statistical infographics, & accordion dropdowns for political topics.
Design Decisions: Integrated ads for engagement, clean infographic visuals, & intuitive navigation for accessibility.
Process
Research: Analyzed voter turnout data and barriers for youth & minorities.
Wireframing: Designed layouts for registration forms, infographics, & topic dropdowns.
Prototyping: Built an interactive prototype tested with target demographics.
UI Design: Developed a high-fidelity design focused on clarity & engagement.
Key Results
Engagement Boost: Overall increase in user interaction.
Minority Turnout: Rise in participation rates.
User Activity: Increase in time spent on the site.
Impact
User Testing: Positive feedback on usability & educational value.
Design Alignment: Matches VoteSource’s mission to empower informed voting.
Anticipated Impact: Stronger community engagement & a model for future campaigns.
Design Question
How might we create a visually engaging and user-friendly infographic site that provides unbiased information on social issues, policy, and voter demographics to empower informed decisions and increase midterm election turnout?
Research
While conducting research for this project, I browsed through the web to find quantitative data and statistical information on midterm voters. I wanted to find factors that impacts voter turnout and discover increases or decreases in turnout categorized by age, race, and gender. Below are some key statistics that I found.
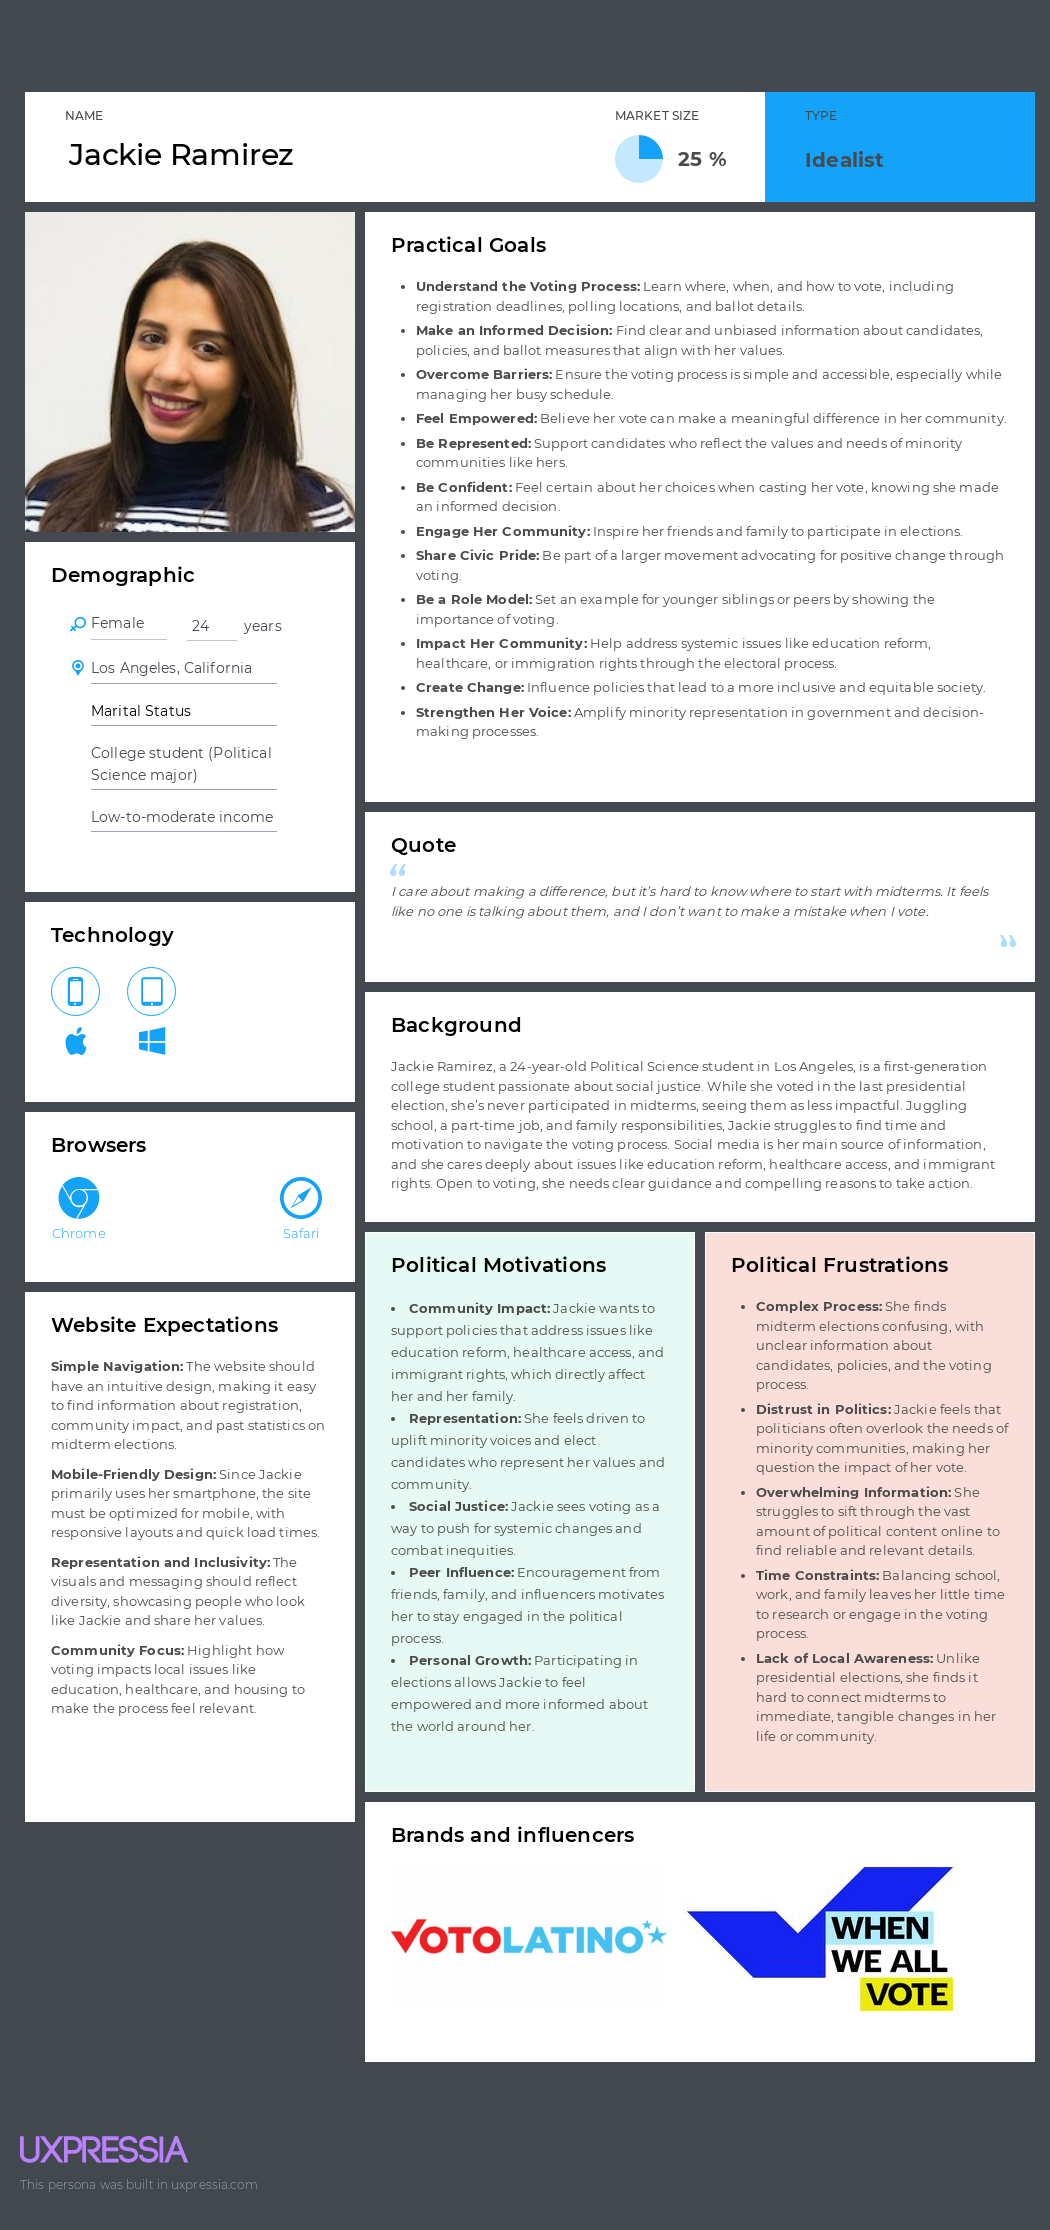
68.3% Of Young Voters Were Reached by Social Media.
59% Of People Were More Motivated To Vote in 2022 Midterms.
A Majority Don't Vote Because They Claim To Be Too Busy.
5% Decrease In Young Voters In 2022 Compared To 2018.
After conducting research, I found that the website should primarely target young, diverse voters. Jackie Ramirez is a Latina college student balancing work and studies and Marcus Johnson is a socially conscious African American professional. These users are open to voting but need motivation and guidance. They value clear, engaging content that connects voting to their personal values, addresses barriers like accessibility or confusion, & simplifies the process to inspire participation in midterm elections.
Brand Style
Votesource represents a fully transparent & informative political style that resonates with people of diverse backgrounds. One constraint for this project was not using the colors, red, blue, & white, so this color scheme takes a different but effective approach.
User Journey Map
The user journey map outlines how young, diverse voters move from awareness to action. Users start by discovering the importance of midterm elections through engaging content and relatable data. They overcome barriers with clear solutions and are guided to register and plan their vote. The journey ends with having the ability to follow Votesource social media platforms and spread awareness and encouraging others to participate. Each stage addresses their needs, feelings, and challenges to inspire action.
Wireframe & Design Comp
Section 1: Background Video, heading, body text
Section 2: Statistical charts regarding midterms
Section 3: Midterm topic accordions & web ads
Section 4: Community impact & web ads
Section 5: Voting registration form
Footer: Logo, email, social icons
UI Breakdown
Section 1: Defining Midterms
Basic introduction to what midterm elections are
Emphasizes impact – how elected officials' policies affect Americans' daily lives
Stresses voter importance – turnout shapes the country's direction
Purpose: Educate and motivate users to participate in democracy
Section 2: Statistic Infographs
Voter turnout by race & age (2014 & 2018)
2024 political priorities (percentage breakdown)
Historical midterm turnout trends
Motivations/reasons for voting/not voting
How young people heard about midterms
2022 House exit polls (by race & gender)
Low youth turnout in 40 states (highlighting opportunity)
Targeted focus on young minority voters
Data sourced from credible quantitative research
Purpose: Show impact potential through data visualization
Section 3: Midterm Topics
Accordion-style topics with expandable details
Covers major political issues being debated in midterms
Explains why each issue matters to Americans
Helps users reflect on personal/political stances
Purpose: Educate voters on critical issues to inform their ballot decisions
Section 4: Testimonials
Personal stories from diverse U.S. citizens
Focus on real-life impacts of midterm elections
Qualitative data sourced from online community forums
Purpose: Build empathy & understanding of voting’s tangible effects
Section 5: Registration Form
Requires first/last name, street address, city, state, ZIP code, & date of birth
Includes optional political party selection & election interest level
Goal: Enable quick registration for midterm elections
User Interactions
Interactive Intro & Nav
Fade-in title animation
Body text fade-in effects
Purpose: Grab visual attention & increase user engagement time
Interactive Infographics
Fade-in effects for political priorities & historical trends charts
Expand-down animation for subsequent charts
Purpose: Direct user focus to statistical data through dynamic visuals
Accordions Interaction
Expands to reveal topic-specific image + body text
Addresses voter knowledge gap (Pew data: 39% didn’t vote due to feeling uninformed)
Purpose: Educate users on midterm topics to combat voter uncertainty
Registration Form Interaction
Clear & concise design to boost midterm turnout
Radio buttons for political party selection
Checkboxes for multiple election interests
Purpose: Streamline registration to empower policy impact
User Scenarios
Scenario 1: A first-time voter visits the site to learn what midterm elections are and why they matter. They quickly grasp the importance of midterms through a clear and visually engaging introduction.
Scenario 2: A young minority voter sees statistics about low voter turnout among their demographic. They reflect on the data and realize the impact their participation can have on shaping the future.
Scenario 3: A voter unsure of which issues align with their values explores the “Midterm Topics” section. They read about key issues, understand their importance, and feel better informed about voting decisions.
Scenario 4: A skeptical user reads personal testimonials from people of diverse backgrounds who share how voting has impacted their lives. The stories inspire empathy and encourage the user to vote.
Scenario 5: A motivated user decides to register to vote after exploring the site. They easily complete the registration form, ensuring they are ready for the upcoming midterm elections.
Supporting These Scenarios
Scenario 1: The homepage provides a clear introduction to midterms with concise content and strong visual hierarchy, ensuring first-time voters quickly understand the purpose and importance of elections.
Scenario 2: The statistical infographics section uses engaging visuals to highlight low turnout rates by race and age, helping young minority voters connect with the data and see their potential impact.
Scenario 3: The “Midterm Topics” section uses accordion navigation to organize political issues, allowing users to explore topics at their own pace and make informed voting decisions.
Scenario 4: The testimonials section shares relatable personal stories, presented in an empathetic and visually appealing format, inspiring trust and encouraging voter participation.
Scenario 5: The registration form is user-friendly, with clear instructions, simplifying the process for motivated users to register and prepare for elections.
User Testing
Use Case 1: Explore the homepage, read the introduction to midterm elections, & scroll to view the animated statistical infographics.
Use Case 2: Navigate to the "Midterm Topics" section, open two accordion dropdowns, & review the content on political issues.
Use Case 3: Visit the "Testimonials" section, read two personal stories, & assess their impact on voting motivation.
Use Case 4: Fill out the voter registration form with sample data, select a political party, & submit the form.
Use Case 5: Interact with the site on a mobile device, exploring the infographics and registration form for responsiveness.
Positive Feedback
"The intro explained midterms in a way that clicked for me right away—the animations kept me engaged while scrolling through the stats."
"The accordion topics were easy to use and gave me a quick, clear rundown of issues like healthcare and education—I feel more ready to vote."
"Reading the testimonials made voting feel personal and real. It was inspiring to see how it impacted people like me."
"The registration form was straightforward—filling it out took less than a minute, and I liked picking my election interests."
"Everything worked smoothly on my phone—the charts and form were just as easy to use as on desktop."
What to Improve
"The infographics are cool, but I’d love a way to pause the animations to read them at my own pace."
"The accordion section is great, but it’d be nice to see a summary or key takeaway for each topic before opening it."
"The testimonials were motivating, but adding a short video or audio clip from one person could make it even more powerful."
"The form worked well, but I’d appreciate a confirmation popup after submitting to know it went through."
Outcomes & Takeaways
What I Achieved: I successfully designed a visually engaging and user-friendly interface that educates users about midterm elections, connects them to relevant topics, and simplifies voter registration.
What I Learned: I learned the importance of using data-driven content and empathetic storytelling to motivate underrepresented groups and how clear information design can drive user action.
Experience Gained: I gained valuable experience balancing user-centered design principles with research-backed content to create a product that inspires trust, educates users, and encourages participation in civic processes.
UX/UI Work
Reality AI - Presentation Generator
An AI-powered tool designed to help educators create engaging, tailored slide presentations based on specific topics, grade levels, and educational objectives.